I have a vintage Ohio Scientific C3-8P computer that I have been trying to restore to a working state . I have found debugging hardware the issues a little frustrating without the ability to trace and watch the programs. So.... with a little time and a little Teensy microcontroller I can now record and display the assembler code running on the 6502 CPU.
The system is based on a Teensy 3.1 running at 96MHz. This is just fast enough to monitor the address/data/control lines on the 1MHz 6502. The Teensy has 34 digital I/O pins which are all 5 volt tolerant. This allowed direct connection to the 6502 pins without voltage shifting issues and provides plenty of room for 16 address, 8 data and 4 control lines.
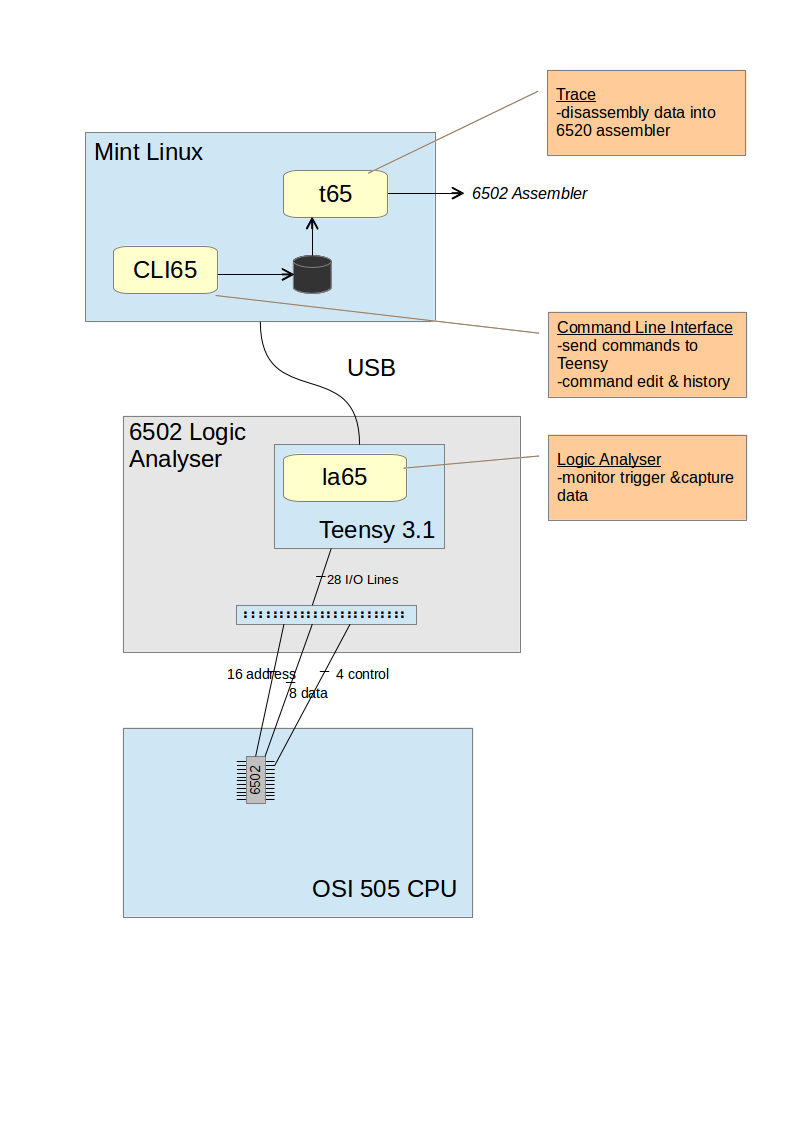
The system is primary based on the Teensy 3.1 doing the hard work of monitoring and recording the data. The system is controlled by a small command line utility on a linux system to set the trigger address and upload the data for analysis. The linux side also includes a disassembler to display the program trace in a mostly human readable form.
The following diagram shows a overview of the system:

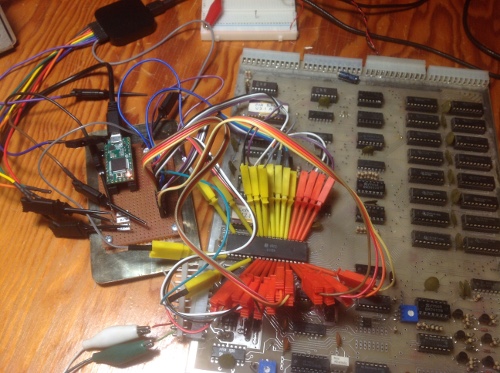
Here is an overview the system build
The Teensy is wired out to a 40 pin ribbon connector is arranged to match the order of the 6502 CPU pins. Connecting 28 test clips to the 6502 is a bit messy. Should probably invest in a IC test clip but in the short term I am using individual test clips.

Once the la65 code is uploaded to the Teensy it will response to simple commands send over the serial port. The cli65 program is a small command line interface with command history and editing. It is used to send commands to the Teensy over the USB serial port.
The Teensy code can be controlled directly using a terminal emulation to talk to the USB serial port but its kind of ugly to do it this way. So far the Teensy understands six commands:
AT            -- Attention: Teensy responses with "OK"
T [address]   -- Trigger: set Trigger to address (4 digit hex number)
T             -- Trigger: T command with no address will display current address
R             -- Run: start waiting for trigger address and capture data on 5k cycles
D [S] [N]     -- Display: display data samples, start at S[0] for N[32] samples
DD            -- Data Dump: display all the recorded data
H             -- Help: display help on commands
.
.
However, using the cli65 make the whole system feel better. The cli65 program understands the following commands:
q                   -- quit
quit                -- quit
set  [address]      -- set or display  trigger address
disp [start] [end]  -- display data
dump [filename]     -- dump all data to terminal and/or file
run                 -- run the analyser wait for trigger and record 5k clock cycles
alive               -- test if Teensy code is alive
at                  -- test if Teensy code is alive
help                -- help on commands
history             -- show command history
.
.
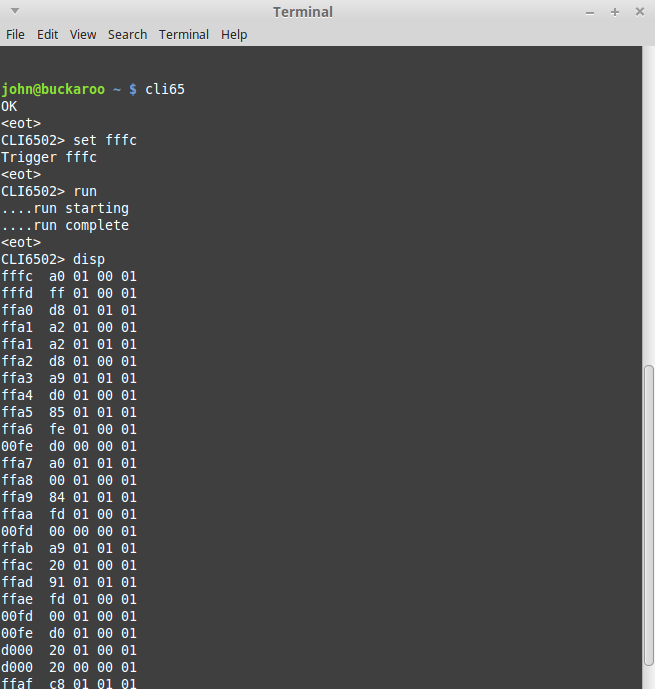
Below is a screenshot of cli65 setting a trigger point, running the analyser, and displaying a few rows of the captured data. The captured data shows the address and data then the state of the R/W, SYNC and IRQ lines. Sinc the line show the opcode fetch it is really helpful in the disassemble process.

The t65 program will disassemble this captured data into 6502 assembler with the data reads (+) and write (-) interspersed with the program trace.
fffc+ a0
fffd+ ff
ffa0  d8        CLD
ffa1+ a2
ffa1  a2 d8     LDX #$d8
ffa3  a9 d0     LDA #$d0
ffa5  85 fe     STA $fe
00fe- d0
ffa7  a0 00     LDY #$00
ffa9  84 fd     STY $fd
00fd- 00
ffab  a9 20     LDA #$20
ffad  91 fd     STA ($fd),Y
00fd+ 00
00fe+ d0
d000+ 20
d000- 20
ffaf  c8        INY
ffb0+ d0
ffb0  d0 fb     BNE $fb
ffb2+ e6
ffad  91 fd     STA ($fd),Y
00fd+ 00
00fe+ d0
d001+ 20
So far the system is quite helpful in tracing the program flow on my broken OSI computer. It would be nice to have multiple trigger addresses in combination of the R/W and SYNC signals...... project enhancements once the snow arrives.
Video -- Using Trace with Logic65
john 2015/11/27